What are LVGL charts?
Charts are how you display a lot of data. It could show the local temperature over the last week or the height a plane is flying. This post has examples on creating and modifying charts.
Getting a Screen to Work In Micropython
This is some simple code to get a ili9341 display to work with micropython lvgl. You will want to add it or your own screen code to the beginning of all the examples on this page.
Instead of putting it at the beginning of your code you could just put this code in the micropython boot file. It seems to work best there.
import lvgl

#this is the code that works for my screen:
#from ili9XXX import ili9341
#screen = ili9341(mosi=23, miso=38, clk=18, dc=15, cs=5, invert=True rot=0x10, width=320, height=240 )

# this is some generic code that might work better for you
from ili9XXX import ili9341
screen = ili9341(mosi=23, miso=38, clk=18, dc=15, cs=5,width=320, height=240)

#You will want some touch screen code
#here is what I use
from ft6x36 import ft6x36
touch = ft6x36()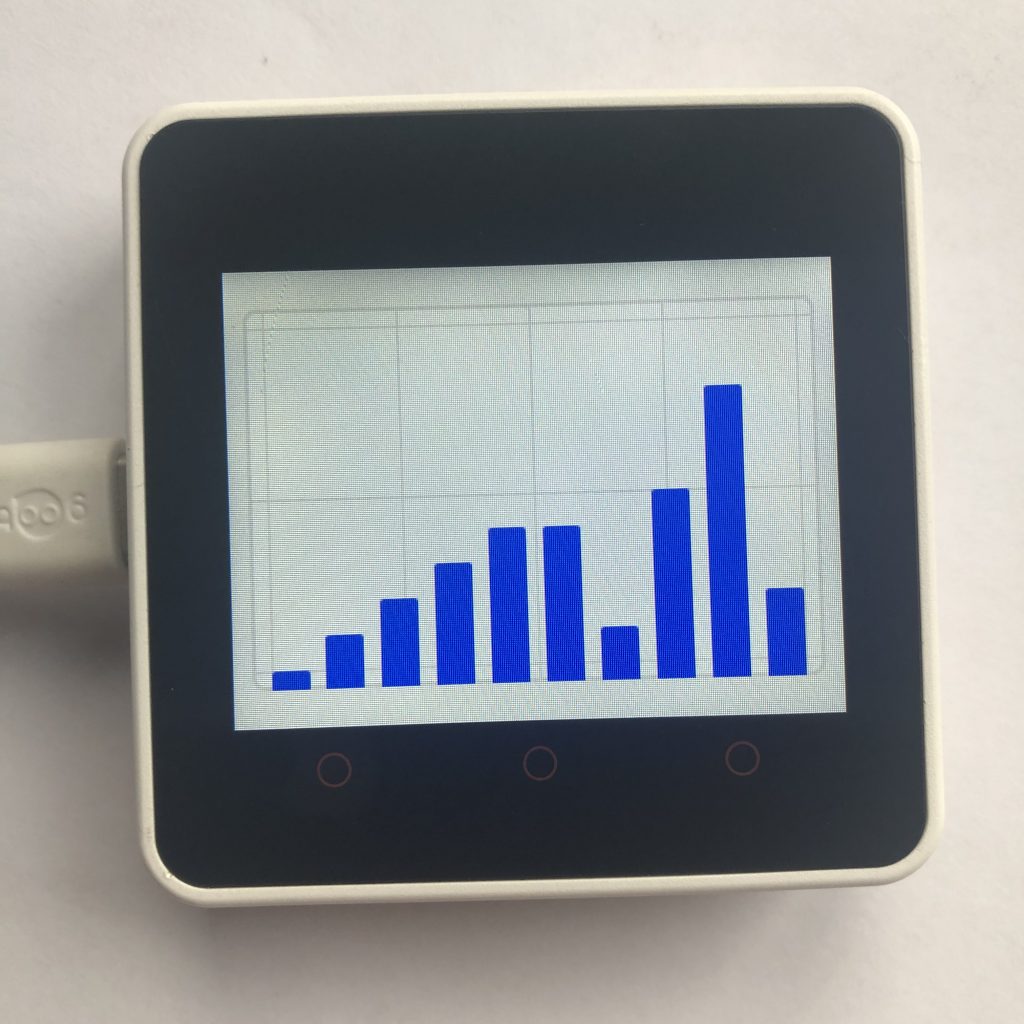
Basic LVGL chart
This code creates a simple bar chart and fills it with a list of numbers.
import lvgl

chart = lvgl.chart( lvgl.scr_act() )
chart.set_size( 300, 200 )
chart.center()
chart.set_type( lvgl.chart.TYPE.BAR )

series = chart.add_series( lvgl.color_hex( 0x0000ff ), lvgl.chart.AXIS.PRIMARY_Y )

values = [ 0, 10, 20, 30, 40, 40, 10, 50, 80, 20 ]
chart.set_ext_y_array( series, values )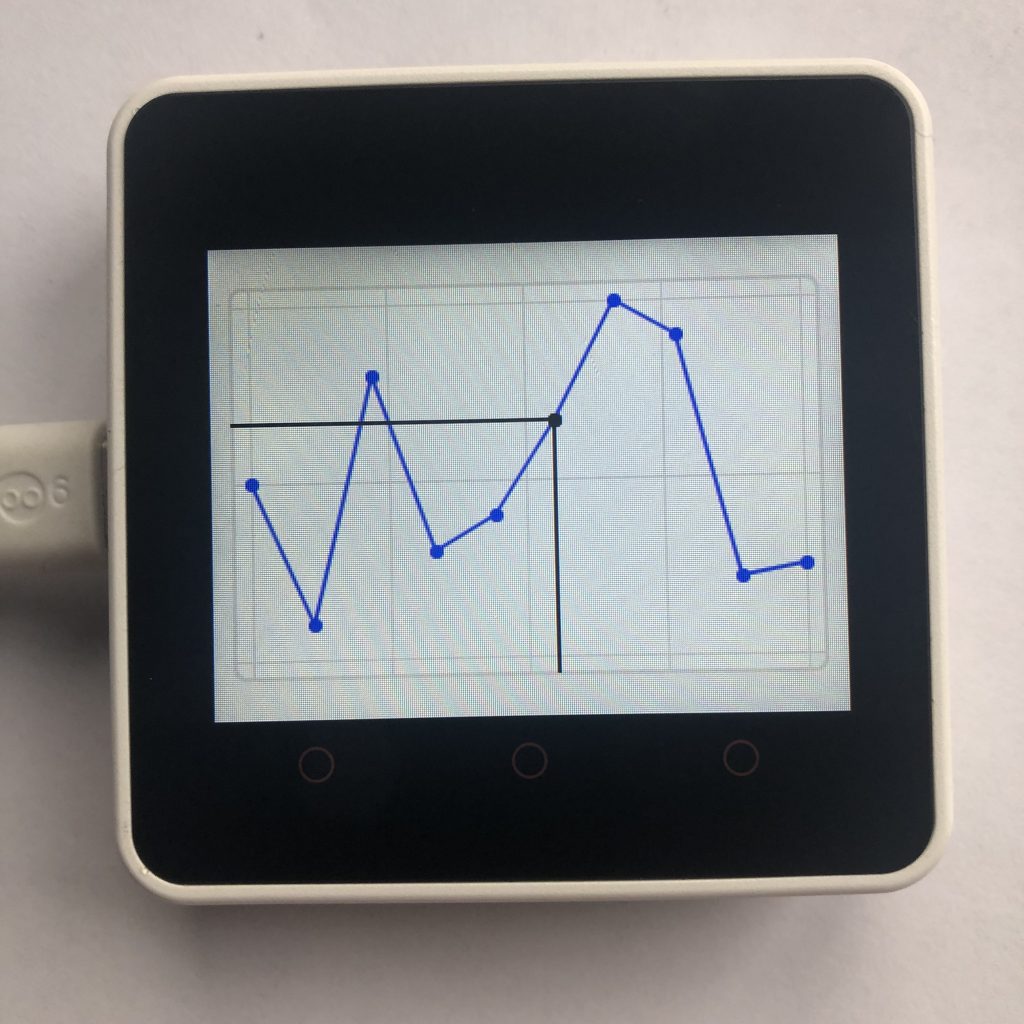
Cursor on a Chart
In lvgl you can create a cursor to select a specific point on your chart.
import lvgl

chart = lvgl.chart( lvgl.scr_act() )
chart.set_size( 300, 200 )
chart.center()

cur = chart.add_cursor( lvgl.color_hex( 0x000000 ), lvgl.DIR.LEFT | lvgl.DIR.BOTTOM )

series = chart.add_series( lvgl.color_hex( 0x0000ff ), lvgl.chart.AXIS.PRIMARY_Y )

values = [ 50, 10, 80, 30, 40, 67, 100, 90, 22, 25 ]
chart.set_ext_y_array( series, values )

chart.set_cursor_point( cur, series, 5 )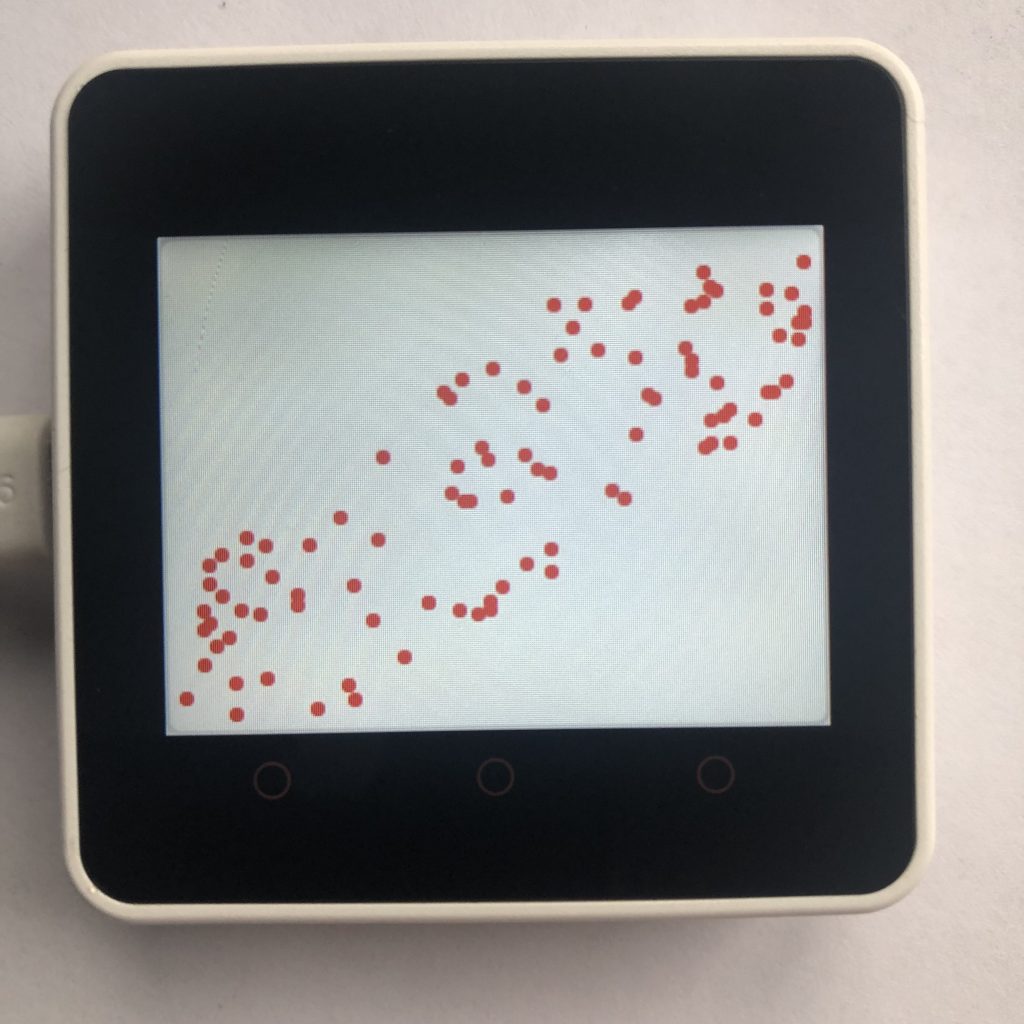
LVGL scatter chart
Scatter plots allow you to put points anywhere you want. This code generates random numbers that look like a diagonal bar.
import lvgl

chart = lvgl.chart( lvgl.scr_act() )
chart.set_size( 320, 240 )
chart.center()
chart.set_type( lvgl.chart.TYPE.SCATTER )
chart.set_style_line_width( 0, lvgl.PART.ITEMS )
chart.set_div_line_count( 0, 0 )
chart.set_point_count( 100 )

series = chart.add_series( lvgl.color_hex( 0xFF0000 ), lvgl.chart.AXIS.PRIMARY_Y )


from time import sleep
while True:
    #minipulate all the random numbers so they make a bar
    x_num = lvgl.rand( 0, 100 )
    y_num = lvgl.rand( max( 0, x_num - 30 ), min( x_num + 30, 100 ))
    chart.set_next_value2( series, x_num, y_num )
    sleep( 0.05 )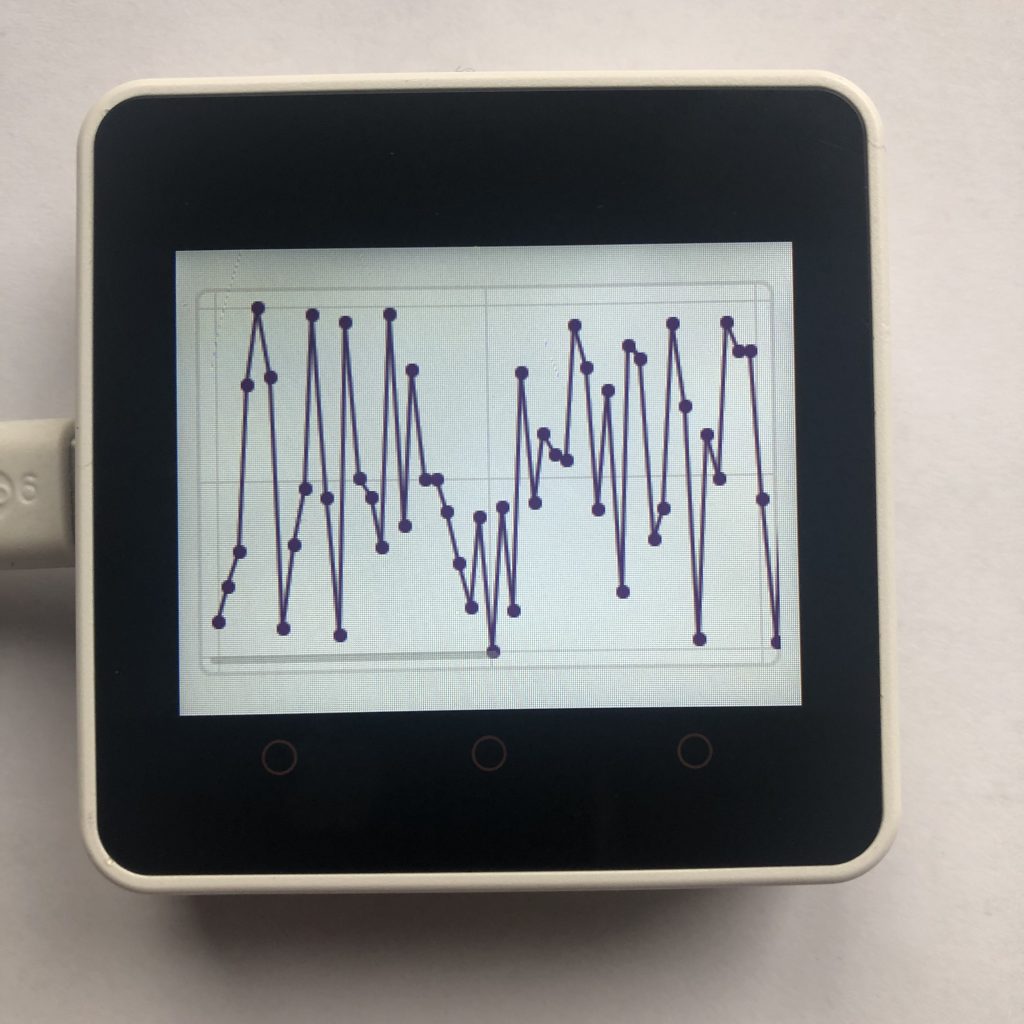
Zooming in on a chart
LVGL charts allow you to zoom in the data. You can scroll around to see the data that has been zoomed out. This code only zooms in on the horizontal axis.
import lvgl

chart = lvgl.chart( lvgl.scr_act() )
chart.set_size( 300, 200 )
chart.center()
chart.set_point_count( 100 )
chart.set_zoom_x( 512 )


series = chart.add_series( lvgl.color_hex( 0x440055 ), lvgl.chart.AXIS.PRIMARY_Y )

for x in range( 100 ):
    chart.set_next_value( series, lvgl.rand( 0, 100 ))

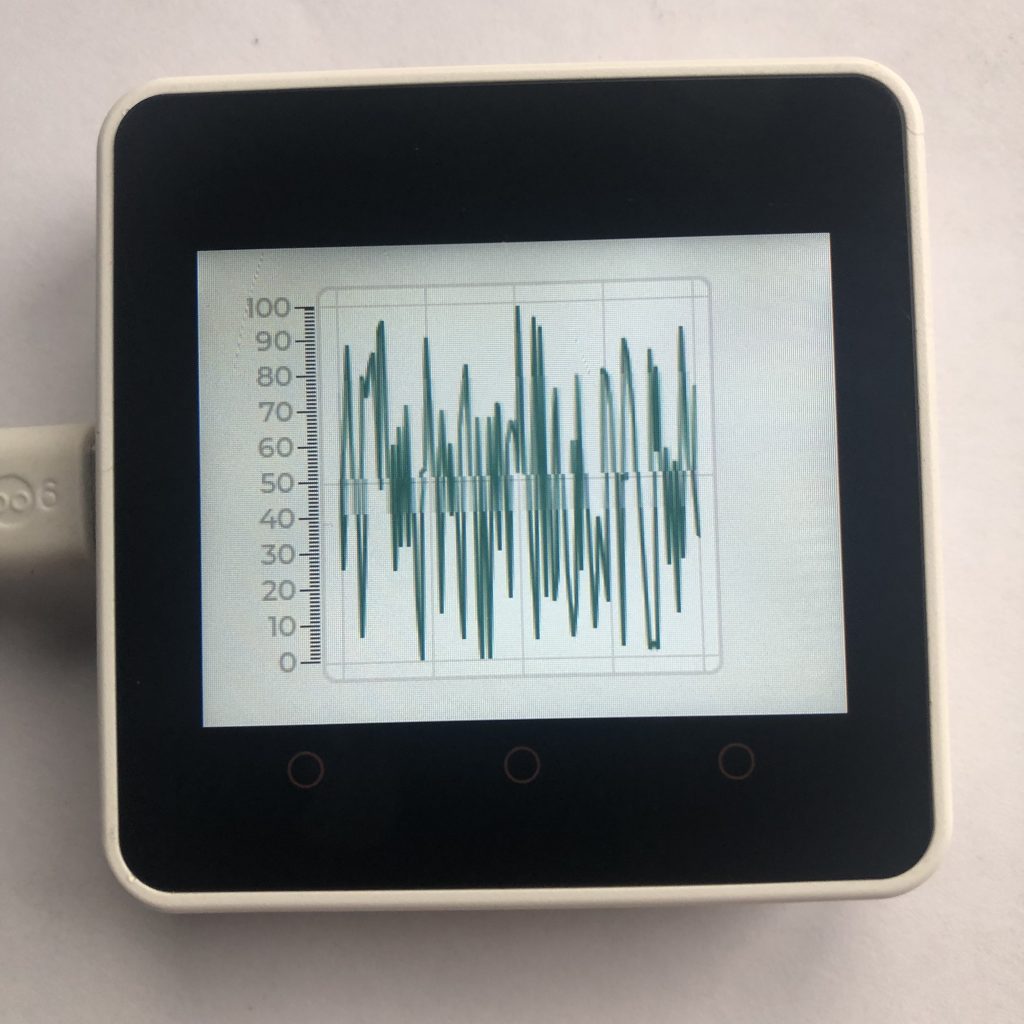
Scrolling data
This code shows how LVGL charts automatically scroll all the data left, when you add more data than a chart can hold.
import lvgl

chart = lvgl.chart( lvgl.scr_act() )
chart.set_size( 200, 200 )
chart.center()
chart.set_point_count( 100 )
chart.set_style_size( 0, 0, lvgl.PART.INDICATOR )
chart.set_axis_tick( lvgl.chart.AXIS.PRIMARY_Y, 10, 5, 11, 9, True, 35 )

series1 = chart.add_series( lvgl.color_hex( 0x005544 ), lvgl.chart.AXIS.PRIMARY_Y )


from time import sleep
while True:
    chart.set_next_value( series1, lvgl.rand( 0, 100 ))
    sleep( 0.05 )
Conclusion of charts
Micropython charts may not be the most exciting thing you can make, but they can be extremely useful if you need to show a lot of data in a small area.
If you liked charts you might like micropython lvgl tabview examples.